
Beautiful Plants For Your Interior
Beautiful Plants For Your Interior
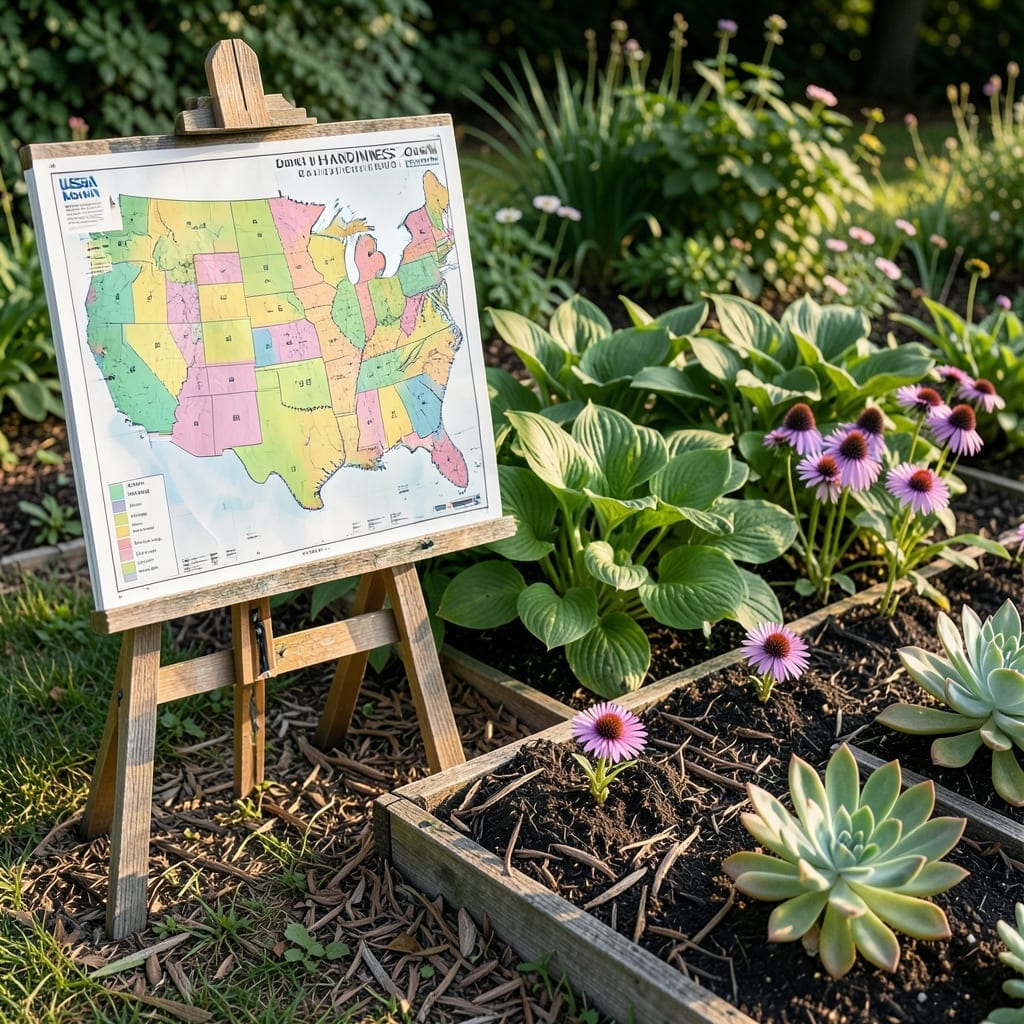
The USDA Plant Hardiness Zone Map divides North America into 13 zones based on average annual minimum winter temperatures, helping gardeners select plants suited to their climate.
I’ve found these zones incredibly useful for planning my garden because they account for 10°F increments that determine plant survival. For example, a plant rated for Zone 5 can handle colder winters than one suited for Zone 8. This system helps avoid costly mistakes, like planting tropical species in areas with harsh freezes. 🌟
💡 In This Article
The USDA uses 30 years of weather station data to calculate the average annual minimum winter temperature for each location. This isn’t just a single year’s cold snap—it’s a long-term pattern that smooths out anomalies. 🌟
Each zone represents a 10°F range, with Zone 1 being the coldest (-60 to -50°F) and Zone 13 the warmest (60 to 70°F). The map updates every 5-10 years to reflect climate shifts, with the 2023 version incorporating data from 1991-2020.
They use a complex algorithm that accounts for elevation, proximity to large bodies of water, and urban heat islands. Mountainous regions can have 5°F differences within just 100 feet of elevation change, creating micro-zones not shown on the main map.
What many don’t realize is that the zones also consider the duration of cold periods. A brief dip to 0°F has less impact than 24 hours at that temperature, which is why the algorithm weighs both intensity and duration of cold snaps. ✨
The map’s resolution has improved dramatically—from 1-mile grids in older versions to 250-meter resolution today. This precision helps gardeners in transition areas between zones make more accurate plant selections. 🔥
Enter your ZIP code on the USDA’s interactive map. It will show your exact zone and even highlight microclimates within your area.
Choose plants rated for the colder zone. For example, if you’re between Zone 6 and 7, select plants rated for Zone 6 for better winter survival.
No, the USDA map focuses on winter lows. For summer heat tolerance, check the AHS Heat Zone Map, which measures how many days exceed 86°F.
The USDA updates the map every 5-10 years, using the most recent 30-year climate data. The 2023 version uses data from 1991-2020.